New: Chart Clutter and the Hesitation It Creates

ORB Trading Charts

Practical chart configuration for the opening range. Marking the boundary so nothing is left to interpret, deciding how many instruments you can genuinely follow at once, and recognising the hesitation a crowded layout produces.

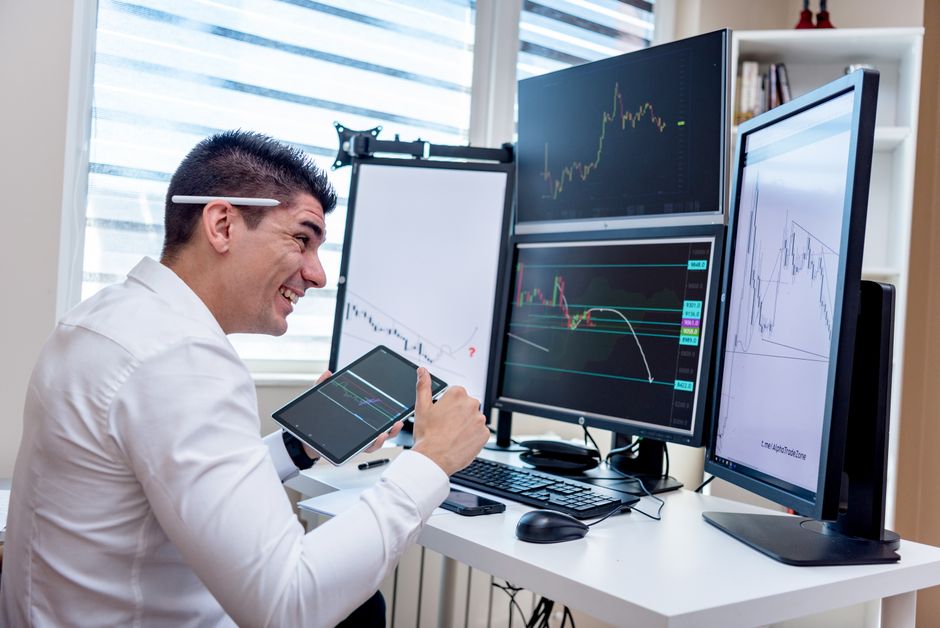
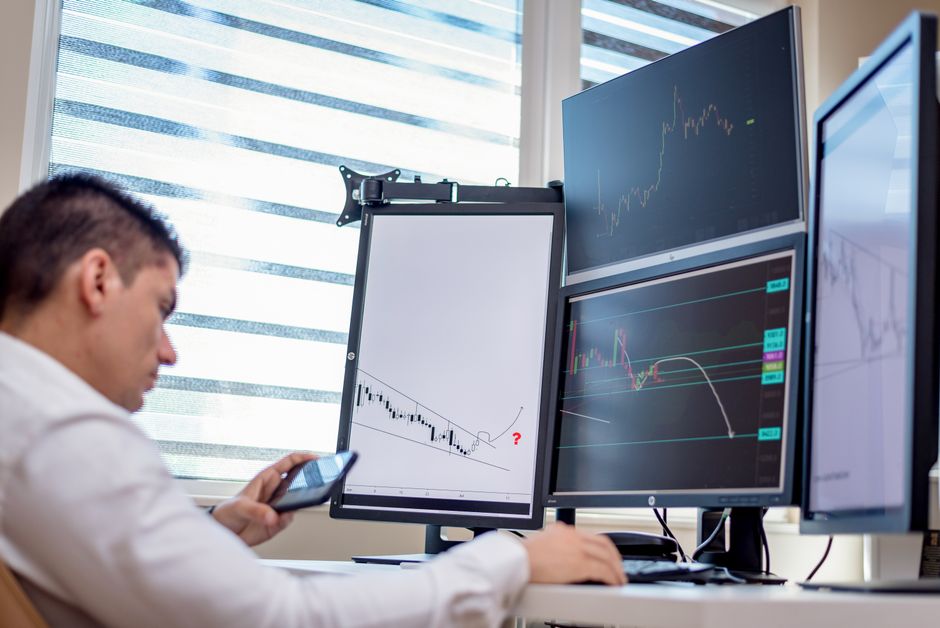
A stock trader analyzes financial data on multiple computer screens in an office setting.

What We Cover

The Screen Is Part of the Method

A chart layout is usually treated as decoration, something arranged once and then ignored. It is closer to equipment. Whatever is on the screen at the open determines what you can see, how quickly you can see it, and how much of the decision is spent locating information rather than acting on it. Two traders running identical rules on differently configured screens are not running the same approach in practice, because one of them is reading and the other is searching.

Marking the Range Is a Configuration Problem

The range needs to be visible as a fixed object, not reconstructed by eye each time you glance at it. Whether the marking is drawn by hand, produced by a session tool, or shaded as a box, the requirement is the same. It must state exactly where the boundary sits, it must not move once the period has closed, and it must be legible at whatever zoom level you actually use. A boundary you have to squint at is a boundary you will interpret.

Screen Count Has a Ceiling

The number of charts a person can genuinely monitor during the first few minutes of a session is smaller than the number they can display. Adding another instrument to the layout feels like adding another chance. What it usually adds is another thing to check while the one you were watching moves. The cost does not appear as a missed setup. It appears as slightly late entries and a general sense of being behind, which is difficult to attribute to layout after the fact.

Clutter Turns Into Hesitation

Every indicator on the chart is a small invitation to reconsider. Most were added for good reasons and few are ever removed. The accumulated effect is a screen on which any decision can be second guessed by something visible, which produces a pause at exactly the moment the plan expects an action. The pause is rarely blamed on the chart, because each individual element looks harmless and defensible on its own.

Setting the Screen Up Properly

The articles here stay on the practical side of chart configuration. They cover marking the opening range so there is nothing left to interpret, deciding honestly how many instruments you can follow at once, and recognising the specific ways a crowded layout slows down execution. They do not deal with which entries to take or where stops belong. Those are separate decisions, and the point of a well configured screen is that it does not interfere with them.

Latest Guides

Trader analyzing financial data on multiple monitors in an office setting.

Chart Clutter and the Hesitation It Creates

Nobody sets out to build a cluttered chart. It happens by addition. An indicator gets added to answer a question raised by a bad session, it stays because removing it feels arbitrary, and a year later the price action is competing for space with a dozen things that were each individually justified at the time they arrived.

Every Element Is a Vote

Professional analyzing stock market graphs on multiple monitors at work desk.

The problem is not visual noise, although that is real. The problem is that anything visible on the chart is implicitly asking to be consulted. If a moving average is drawn and price is on the wrong side of it, the fact registers whether or not your rules mention moving averages anywhere.

That registration takes a moment and it introduces doubt into a decision that the plan intended to be mechanical. The plan says take the break. The screen says here are four other considerations. The plan wins most of the time, but it wins after a pause, and the pause is the cost.

Hesitation Is Expensive in a Specific Way
A professional in an office analyzing financial charts on multiple monitors, using advanced technology.

A break of the range boundary is often quick. Waiting through a moment of doubt means entering further from the level, which widens the distance to the stop if the stop sits at the opposite edge, and reduces what remains available to the target. Both halves of the trade get slightly worse from a delay that was never a decision.

Worse, the hesitation is not consistent. On sessions where the extra indicators happen to agree with the signal, there is no pause. On sessions where they disagree, there is. That means the clutter is quietly filtering trades, and it is filtering them by a rule you never wrote and could not state if asked.

Each One Looks Defensible Alone

Ask why any single element is on the chart and there will be an answer. It provides context. It shows the trend. It marks yesterday's levels. These are all reasonable, and none of them is the point. The point is the cumulative effect of a screen where something is always available to contradict the trigger.

This is why removing clutter one item at a time rarely works. Each individual removal has to be argued against a plausible justification, and the justification usually wins, because it is easier to describe what an indicator adds than to describe what a clean chart adds.

Strip It Back and Add Deliberately

The workable approach is to go the other way. Start from price and the range marking and nothing else, then add only what a written rule explicitly requires. If a rule references a level, that level goes on the chart. If nothing in the rule set references it, it stays off, regardless of how useful it feels.

This turns the chart into a direct reflection of the plan, which has a useful side effect. If the chart looks empty, the rules are simple, and that is worth knowing. If reconstructing the chart from the rules produces a crowded screen, the rule set is more complicated than it seemed when it was a list of sentences.

Colour and Weight Are Part of It

Reduction is not only about how many elements are present. It is also about which ones dominate. If the range boundary is a thin grey line and a secondary indicator is a bold coloured band, the eye will go to the band first, and the most important object on the chart is the one that is hardest to see.

Whatever the trigger depends on should be the most visually prominent thing on the screen, and everything else should be quieter than it feels comfortable making it. A layout arranged that way tends to feel slightly stark for the first week and then stops being noticeable at all, which is the correct end state. The chart is not there to be interesting. It is there to make one particular fact immediately obvious, and everything that competes with that fact is working against the plan even when it is technically correct.

Businessman analyzing stock market data on dual monitors in a modern office setting.

How Many Charts You Can Actually Watch at the Open

Screen real estate is cheap and attention is not. A layout can hold a dozen instruments comfortably, and every one of them will render correctly, update in real time and look perfectly manageable during a quiet stretch. The first few minutes after the open are not a quiet stretch, and that is the only window in which the layout is actually being tested.

Watching and Displaying Are Different Verbs

A focused shot of financial trading with screens, calculator, and data charts.

A chart is displayed if it is on the screen. A chart is watched if you would notice, within a second or two, that it just did something. The second condition is much harder to satisfy, because noticing requires the eye to be there or to arrive quickly, and the eye can only be in one place.

Most people estimate their capacity by asking how many charts they can see, which is the wrong question and always returns a flattering answer. The better question is how many charts you could describe the current state of, right now, without looking. That number tends to be small and it does not grow with monitor count.

The Cost Does Not Announce Itself

A man engaged in financial data analysis on multiple monitors in an office setting.

If extra charts caused visible failures the problem would solve itself. What they cause instead is a slight delay. The setup still gets taken, just a little later than it would have been, because the two seconds before you looked were spent on something else. Entries drift a fraction worse. Occasionally a move is caught halfway rather than at the boundary.

None of that shows up in a journal as a mistake. It shows up as ordinary variation in fill quality, which is exactly what it looks like from the inside. The layout is never suspected, because on any individual session the layout was not obviously in the way.

The Open Is the Worst Possible Time to Divide Attention

The whole premise of trading a range formed at the open is that something decisive happens in a short window. Several instruments will often be doing that at once, because they respond to the same session start. This is precisely when the cost of monitoring many charts peaks, and it is also when the temptation to monitor many charts is strongest, since more instruments plausibly means more chances.

The chances are real. The capacity to act on them is not, and a signal you see but arrive at late is frequently worse than a signal you never saw, because it invites a rushed entry at a price the plan never contemplated.

Finding Your Own Number

The honest way to measure this is to run a smaller layout deliberately for a run of sessions and see whether the quality of your executions changes. Not the number of trades, which will fall by construction, but how close the fills sit to the intended level and how often you feel behind the move.

Most people who try this discover their working limit is lower than they expected and that the reduction costs them less than they feared, because the instruments they dropped were rarely the ones they traded anyway. They were on the screen out of habit, or because a setup appeared there once and left an impression.

Structuring What Stays

If more than one instrument survives the cut, the layout should make the ranking explicit rather than treating them as equals. One chart is the primary and gets the largest panel and the centre of the field of view. The others sit around it and are checked, not watched, with the understanding that if the primary is active the others are effectively invisible for the duration.

Deciding this in advance also settles what happens when two of them trigger together, which is otherwise resolved in the moment by whichever chart your eye landed on first. That is not a decision anyone should be making at speed, and having a stated primary means it never has to be made at all. The layout answers it, quietly, before the session begins.

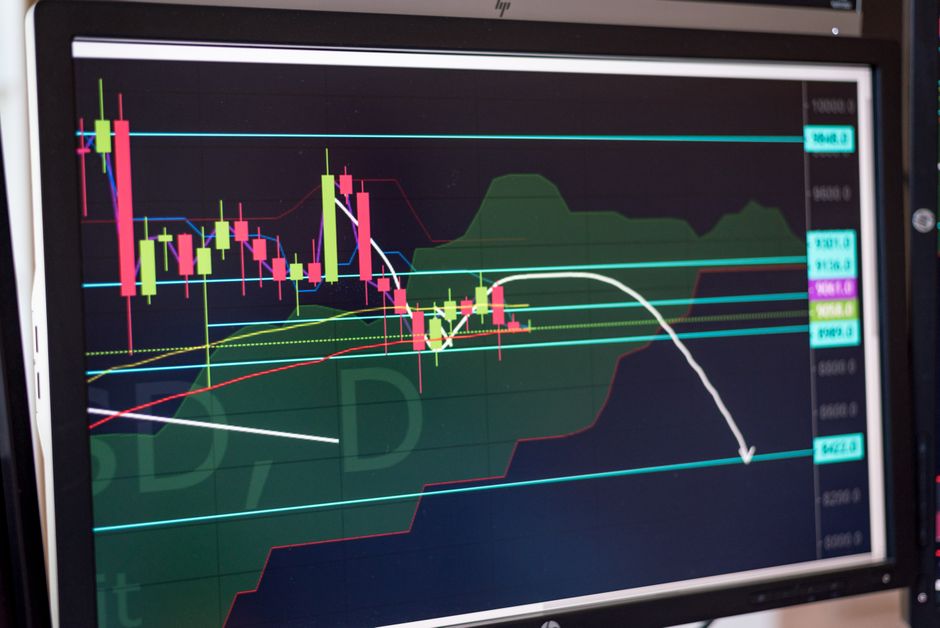
Financial chart displayed on monitor showcasing stock market trends and analysis.

Marking the Range So There Is Nothing to Interpret

Ask two traders where the range high is and you can get two answers on the same chart. One is reading the top of the wick, the other the top of the body. One drew the line while the period was still forming and never adjusted it. The rule they are following is identical. The level they are trading is not, and neither of them thinks of this as a rules problem.

Decide What Counts as the Boundary

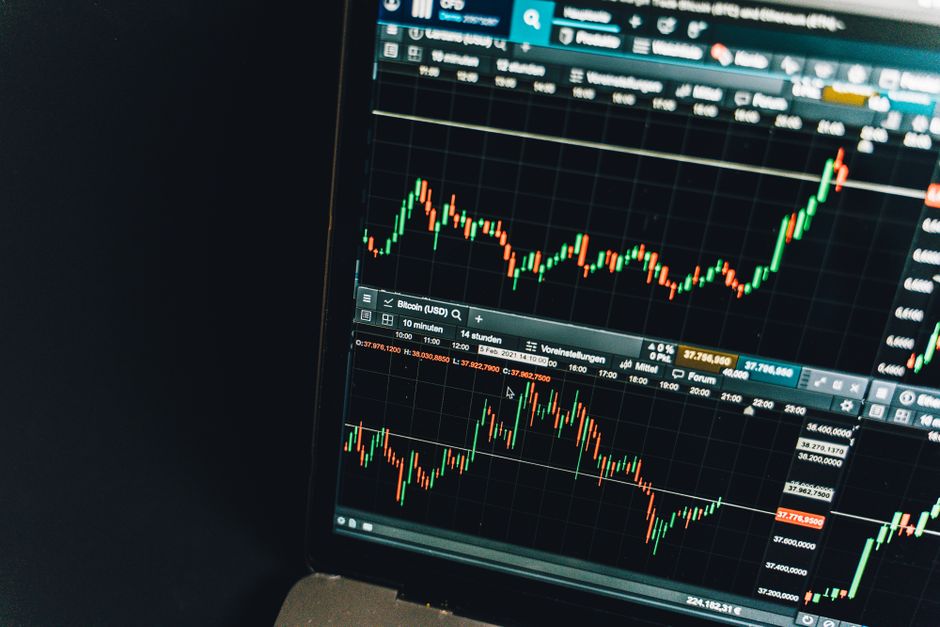
Close-up of a live cryptocurrency trading chart screen displaying dynamic market trends and analysis.

The first choice is whether the range is defined by the extreme price traded during the period or by the closing prices of the bars within it. Both are defensible. Extremes capture everything that happened, including a single fast print that nobody defended. Closes ignore that print and describe where price actually settled.

What matters is that the answer is fixed and applies everywhere. A trader who uses wicks on quiet days and bodies on days with a violent first minute is not applying a definition. They are choosing whichever boundary produces the trade they prefer, and doing it invisibly, because the choice happens while drawing rather than while deciding.

Draw It Once, Then Stop

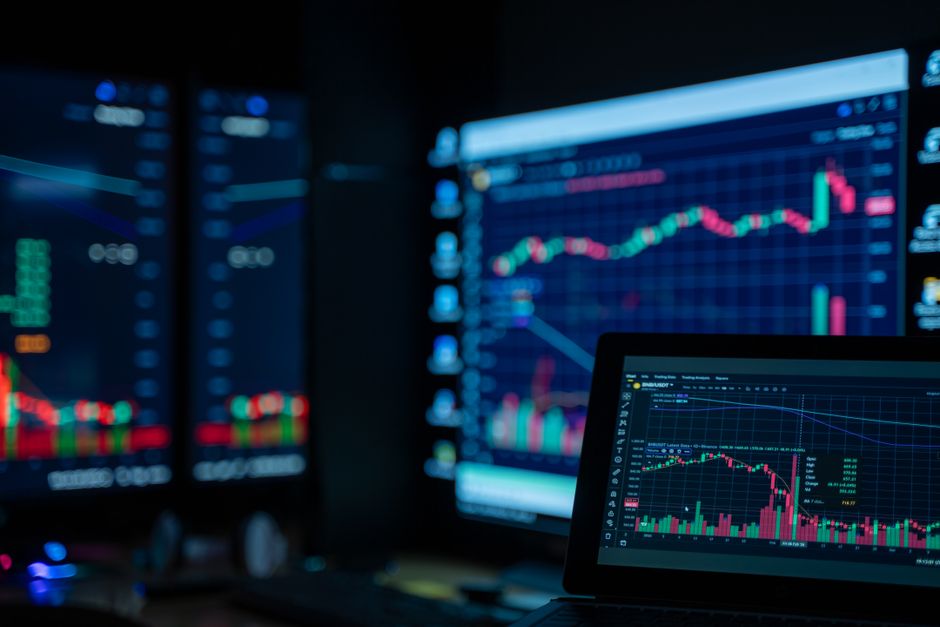
Monitors displaying stock market charts in a dimly lit room, perfect for finance and trading themes.

Lines drawn during the formation period get adjusted, because price keeps making new extremes and the hand keeps following. That is fine while the period is open. The problem is the habit continuing after it closes, when a small overshoot tempts a small nudge, and the boundary quietly follows price instead of constraining it.

The cleanest arrangement is that the marking is created at the moment the period ends and is not touched again for the rest of the session. If a tool does this automatically, better, because the tool has no opinion. If it is done by hand, the discipline is to accept an ugly line rather than improve it.

Shading Reads Faster Than Lines

Two horizontal lines require you to work out which one you are near. A shaded box makes inside and outside a single glance rather than a comparison. That difference is trivial when you are reviewing a chart later and significant when the decision is live, because the eye resolves a filled region faster than it resolves the relationship between two thin strokes.

The shading needs to be subdued enough that candles remain readable through it. A box so dark that price disappears inside it solves one legibility problem by creating another, and the fix people usually apply is to look at the price scale instead, which is slower than either.

Precision You Do Not Actually Have

It is tempting to mark the boundary to the smallest increment the instrument quotes and treat that number as exact. It is exact as a record of what printed. It is not exact as a level, because the last tick of the period is a single event and the next session will not respect it to the tick.

This argues for consistency over precision. Whatever tolerance you use, whether the trigger is a touch, a trade beyond, or a close beyond, it should be defined in the same terms as the marking. A boundary marked from wicks and a trigger defined on closes are two different measurements pretending to be one, and the gap between them is where the arguments at the trigger come from.

Test the Marking on Old Charts

The way to find out whether a marking scheme is unambiguous is to scroll back through sessions you do not remember and mark them cold. If you find yourself pausing, or wanting to know what happened next before committing to a line, the scheme still contains judgement.

Doing this on a run of past sessions also shows you how the marking behaves on the awkward days, the ones with a spike in the first bar or a period that barely moves at all. Those are the sessions where an underspecified scheme produces its worst results, and they are the sessions least likely to be in your head when you design the scheme in the first place. A marking rule that only works on tidy days is not a marking rule.

Back to top

© Chart Setup Notes 2026

ayearofkilling